عنوان:
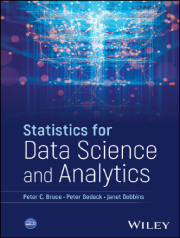
Statistics for Data Science and Analytics Edition: 1
نویسنده:
Peter C. Bruce; Peter Gedeck; Janet Dobbins
انتشارات:
Wiley
تاریخ انتشار:
2024
حجم:
3.8MB
معرفی کتاب: " آمار برای علم داده و تحلیل دادهها"
راهنمایی جامع برای تحلیلهای آماری در علوم داده، شامل پیشبینی، همبستگی و کاوش دادهها
درباره کتاب
کتاب آمار مقدماتی با استفاده از پایتون مرجعی کاربردی و پروژهمحور برای علاقهمندان به علوم داده، تحلیلگران و برنامهنویسانی است که میخواهند مهارتهای آماری خود را با زبان پایتون تقویت کنند. این کتاب، مفاهیم آماری را از طریق مثالهای واقعی، قطعهکدهای پایتون و تمرینهای قابل اجرا آموزش میدهد تا یادگیری را عمیق و کاربردی کند.
آنچه خواهید آموخت:
- آزمون فرضیه، احتمال، تحلیل اکتشافی دادهها (EDA)
- نمونهگیری، طراحی نظرسنجی و آزمون A/B
- تحلیل متغیرهای طبقهای و بررسی همبستگی
- مبانی یادگیری ماشین: طبقهبندی دودویی، اعتبارسنجی با دادههای نگهداشتهشده (Holdout)
- استنتاج آماری با Bootstrap
- رگرسیون برای تبیین و پیشبینی
کتابخانههای مورد استفاده در کتاب:
NumPy، pandas، SciPy، scikit-learn، و statsmodels
ساختار هر فصل:
- مقدمهای تئوری بر موضوع آماری
- مثالهای عملی همراه با پیادهسازی در پایتون
- تمرینهایی برای سنجش مهارت و درک بهتر
مخاطبان این کتاب:
این کتاب برای دانشجویان علوم داده، تحلیلگران، مدرسین و هر فردی که در شروع مسیر علوم داده یا تحلیل آماری قرار دارد مفید است. اگر نیاز دارید مفاهیم آماری را در قالب کد اجرا کنید، این منبع بهترین نقطه شروع است.
فهرست مطالب
- Front Matter
- Title Page
- Copyright
- Contents
- About the Authors
- Acknowledgments
- About the Companion Website
- Introduction
- Chapter 1
- 1.1 Big Data: Predicting Pregnancy
- 1.2 Phantom Protection from Vitamin E
- 1.3 Statistician, Heal Thyself
- 1.4 Identifying Terrorists in Airports
- 1.5 Looking Ahead
- 1.6 Big Data and Statisticians
- Chapter 2
- 2.1 Statistical Science
- 2.2 Big Data
- 2.3 Data Science
- 2.4 Example: Hospital Errors
- 2.5 Experiment
- 2.6 Designing an Experiment
- 2.7 The Data
- 2.8 Variables and Their Flavors
- 2.9 Python: Data Structures and Operations
- 2.10 Are We Sure We Made a Difference?
- 2.11 Is Chance Responsible? The Foundation of Hypothesis Testing
- 2.12 Probability
- 2.13 Significance or Alpha Level
- 2.14 Other Kinds of Studies
- 2.15 When to Use Hypothesis Tests
- 2.16 Experiments Falling Short of the Gold Standard
- 2.17 Summary
- 2.18 Python: Iterations and Conditional Execution
- 2.19 Python: Numpy, scipy, and pandas—The Workhorses of Data Science
- Exercises
- Chapter 3
- 3.1 Exploratory Data Analysis
- 3.2 What to Measure—Central Location
- 3.3 What to Measure—Variability
- 3.4 What to Measure—Distance (Nearness)
- 3.5 Test Statistic
- 3.6 Examining and Displaying the Data
- 3.7 Python: Exploratory Data Analysis/Data Visualization
- Exercises
- Chapter 4
- 4.1 Avoid Being Fooled by Chance
- 4.2 The Null Hypothesis
- 4.3 Repeating the Experiment
- 4.4 Statistical Significance
- 4.5 Power
- 4.6 The Normal Distribution
- 4.7 Summary
- 4.8 Python: Random Numbers
- Exercises
- Chapter 5
- 5.1 What Is Probability
- 5.2 Simple Probability
- 5.3 Probability Distributions
- 5.4 From Binomial to Normal Distribution
- 5.5 Appendix: Binomial Formula and Normal Approximation
- 5.6 Python: Probability
- Exercises
- Chapter 6
- 6.1 Two‐way Tables
- 6.2 Conditional Probability
- 6.3 Bayesian Estimates
- 6.4 Independence
- 6.5 Multiplication Rule
- 6.6 Simpson's Paradox
- 6.7 Python: Counting and Contingency Tables
- Exercises
- Chapter 7
- 7.1 Literary Digest—Sampling Trumps “All Data”
- 7.2 Simple Random Samples
- 7.3 Margin of Error: Sampling Distribution for a Proportion
- 7.4 Sampling Distribution for a Mean
- 7.5 The Bootstrap
- 7.6 Rationale for the Bootstrap
- 7.7 Standard Error
- 7.8 Other Sampling Methods
- 7.9 Absolute vs. Relative Sample Size
- 7.10 Python: Random Sampling Strategies
- Exercises
- Chapter 8
- 8.1 Count Data—R × C Tables
- 8.2 The Role of Experiments (Many Are Costly)
- 8.3 Chi‐Square Test
- 8.4 Single Sample—Goodness‐of‐Fit
- 8.5 Numeric Data: ANOVA
- 8.6 Components of Variance
- 8.7 Factorial Design
- 8.8 The Problem of Multiple Inference
- 8.9 Continuous Testing
- 8.10 Bandit Algorithms
- 8.11 Appendix: ANOVA, the Factor Diagram, and the F‐Statistic
- 8.12 More than One Factor or Variable—From ANOVA to Statistical Models
- 8.13 Python: Contingency Tables and Chi‐square Test
- 8.14 Python: ANOVA
- Exercises
- Chapter 9
- 9.1 Example: Delta Wire
- 9.2 Example: Cotton Dust and Lung Disease
- 9.3 The Vector Product Sum Test
- 9.4 Correlation Coefficient
- 9.5 Correlation is not Causation
- 9.6 Other Forms of Association
- 9.7 Python: Correlation
- Exercises
- Chapter 10
- 10.1 Finding the Regression Line by Eye
- 10.2 Finding the Regression Line by Minimizing Residuals
- 10.3 Linear Relationships
- 10.4 Prediction vs. Explanation
- 10.5 Python: Linear Regression
- Exercises
- Chapter 11
- 11.1 Terminology
- 11.2 Example—Housing Prices
- 11.3 Interaction
- 11.4 Regression Assumptions
- 11.5 Assessing Explanatory Regression Models
- 11.6 Assessing Regression for Prediction
- 11.7 Python: Multiple Linear Regression
- Exercises
- Chapter 12
- 12.1 K‐Nearest‐Neighbors
- 12.2 Python: Classification
- Exercises
- Index
مشخصات
نام کتاب
Statistics for Data Science and Analytics Edition: 1
نویسنده
Peter C. Bruce; Peter Gedeck; Janet Dobbins
انتشارات
Wiley
تاریخ انتشار
2024
ISBN
9781394253807
تعداد صفحات
366
زبان
انگلیسی
فرمت
حجم
3.8MB
موضوع
Computers > Software: Systems: scientific computing
